
Introduction to World Geography
Geography is the study of the Earth, its physical features, environments, and the relationship between people and places. The word geography comes from the Greek words geo (Earth) and graphos (to write or describe), meaning “description of the Earth.”
Geography has two main branches:
- Physical Geography – studies natural features such as landforms, climate, rivers, oceans, and ecosystems.
- Human Geography – examines people, cultures, populations, settlements, and human activities.
A key part of geography is cartography, the science and art of making maps. Modern maps, including GPS technology, help people locate places and navigate accurately.
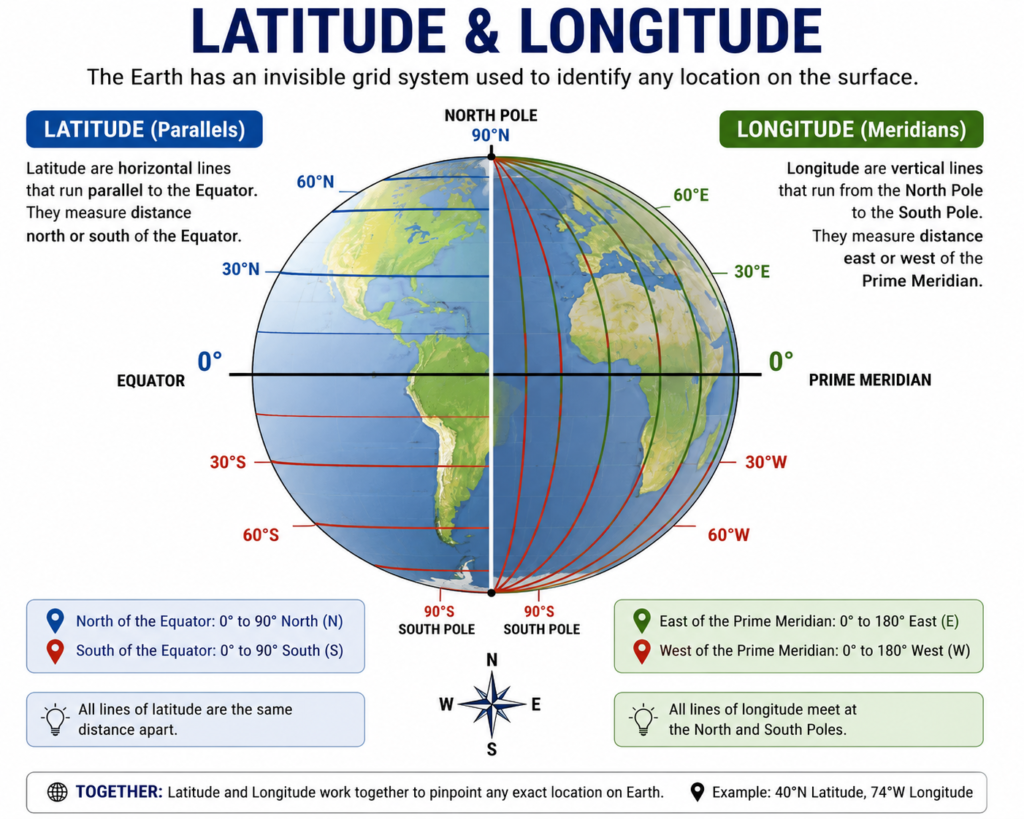
To identify any location on Earth, geographers use the geographic grid, which is made up of:
- Latitude – imaginary parallel lines that measure distance north or south of the Equator (0° to 90°).
- Longitude – imaginary meridian lines that measure distance east or west of the Prime Meridian (0° to 180°).
Two important reference lines are:
- Prime Meridian (0°) – passes through Greenwich, England, and is the starting point for measuring longitude.
- International Date Line (around 180° longitude) – marks the place where the calendar date changes when crossed.
Basic Geography Terms
| Term | Simple Definition |
|---|---|
| Diffusion | The spread of ideas, cultures, technologies, or products from one place to another. |
| Environmental Determinism | The idea that the natural environment strongly influences how people live and develop their cultures. |
| Expansion Diffusion | The spread of an idea or innovation outward from its place of origin while remaining strong there. |
| Formal Region | An area where people or places share one or more common characteristics, such as language, climate, or religion. |
| Functional Region | An area organized around a central place, such as a city, school, or shopping center. |
| Geographic Information System (GIS) | A computer-based system used to collect, analyze, and display geographic data on maps. |
| Geographos | A Greek word meaning “writing about the Earth.” |
| Geography | The study of the Earth, its physical features, environments, and human activities. |
| Human Geography | The branch of geography that studies people, cultures, populations, and their relationship with the environment. |
| International Date Line | An imaginary line near 180° longitude where the calendar date changes. |
| Latitude | Imaginary lines that measure distance north or south of the Equator. |
| Longitude | Imaginary lines that measure distance east or west of the Prime Meridian. |
| Meridians | Imaginary lines running from the North Pole to the South Pole. |
| Parallels | Imaginary lines running east to west, parallel to the Equator. |
| Possibilism | The idea that people can adapt to their environment and make choices despite natural limitations. |
| Physical Geography | The branch of geography that studies natural features such as mountains, rivers, climate, and landforms. |
| Prime Meridian | The 0° longitude line passing through Greenwich, England. |
| Projection | A method of showing the Earth’s curved surface on a flat map. |
| Region | An area that shares common physical or human characteristics. |
| Relocation Diffusion | The spread of ideas or cultures when people move from one place to another. |
| Remote Sensing | Collecting information about the Earth’s surface using satellites, aircraft, or drones. |
| Scale | The relationship between distances on a map and actual distances on the Earth’s surface. |
| Site | The physical characteristics of a place, such as landforms, climate, and vegetation. |
| Situation | The location of a place in relation to nearby places or features (relative location). |
Latitude and Longitude
Latitude and longitude are the imaginary lines used to identify the exact location of any place on Earth. Together, they form the geographic coordinate system.
Latitude
- Latitude measures the angular distance north or south of the Equator.
- The Equator (0°) is the starting point for measuring latitude.
- Latitude ranges from 0° to 90° North (N) and 0° to 90° South (S).
- Lines of latitude are called parallels because they never meet.
- The distance between each degree of latitude is approximately 111 km (69 miles).
- Latitude is used to determine climate zones and the position of places.
Longitude
- Longitude measures the angular distance east or west of the Prime Meridian.
- The Prime Meridian (0°) passes through Greenwich, England.
- Longitude ranges from 0° to 180° East (E) and 0° to 180° West (W).
- Lines of longitude are called meridians.
- Meridians meet at the North Pole and South Pole.
- Longitude is mainly used to determine time zones and location.
Geographic Coordinate System
- The intersection of a latitude and a longitude gives the exact geographic coordinates of a place.
- Every location on Earth has a unique pair of latitude and longitude values.
- This system is used in maps, GPS, navigation, aviation, shipping, and surveying.
Measuring Coordinates
Geographic coordinates can be written in two formats:
1. Degrees, Minutes, and Seconds (DMS)
- 1 Degree (°) = 60 Minutes (′)
- 1 Minute (′) = 60 Seconds (″)
Example:
- 38° 53′ 19″ N
- 77° 0′ 17″ W
2. Decimal Degrees (DD)
- Coordinates are written as decimal numbers.
- North and East values are positive (+).
- South and West values are negative (−).
Example:
- 38.888611°
- −77.004722°
Key Facts
- The Earth is divided into 360°.
- Latitude and longitude together create a global reference grid.
- Latitude lines are parallel and never intersect.
- Longitude lines converge at the poles.
- The Equator divides Earth into the Northern and Southern Hemispheres.
- The Prime Meridian divides Earth into the Eastern and Western Hemispheres.
- The 180° longitude is close to the International Date Line, where the calendar date changes.
Quick Comparison
| Feature | Latitude | Longitude |
|---|---|---|
| Measures | North–South distance | East–West distance |
| Starting Line | Equator (0°) | Prime Meridian (0°) |
| Range | 0°–90° N/S | 0°–180° E/W |
| Lines Called | Parallels | Meridians |
| Do the Lines Meet? | No, they remain parallel | Yes, they meet at the poles |
| Main Use | Location and climate | Location and time zones |
Time Zones
Time zones are regions of the Earth that use the same standard time. They are based on the Earth’s rotation and lines of longitude, allowing people around the world to keep a consistent local time.
What is a Time Zone?
- A time zone is an area where the same standard time is observed.
- Earth rotates 360° in 24 hours.
- Therefore, Earth rotates 15° every hour (360° ÷ 24 = 15°).
- Each 15° of longitude represents approximately 1 hour of time difference.
How Time Zones Work
- The Prime Meridian (0° longitude) at Greenwich, England, is the starting point for world time.
- The world’s standard reference time is Coordinated Universal Time (UTC) (formerly known as Greenwich Mean Time – GMT).
- Time changes by 1 hour for every 15° of longitude traveled.
- Moving east → Time becomes 1 hour later for every 15°.
- Moving west → Time becomes 1 hour earlier for every 15°.
Easy Rule to Remember
- East = Add Time (+)
- West = Subtract Time (−)
UTC Offsets
Countries express their local time as an offset from UTC.
Examples:
- Pakistan: UTC +5
- India: UTC +5:30
- United Kingdom (winter): UTC ±0
- Japan: UTC +9
- New York (Standard Time): UTC −5
International Date Line (IDL)
- Located near 180° longitude.
- Crossing the IDL changes the calendar date.
- Crossing westward → Add 1 day.
- Crossing eastward → Subtract 1 day.
Important Facts
- There are 24 main time zones based on Earth’s rotation.
- In reality, there are more than 24 time zones because many countries adjust time zones to match political boundaries.
- Some countries use 30-minute or 45-minute time offsets instead of whole hours.
Daylight Saving Time (DST)
- Some countries move their clocks forward by 1 hour during summer to make better use of daylight.
- This is called Daylight Saving Time (DST).
- Many countries, including Pakistan, do not use DST.
Calculating Longitude from Time
Longitude can be calculated using the relationship between time and Earth’s rotation.
Formula:
Longitude = Time Difference × 15°
Example
If local time differs from UTC by 4 hours:
4 × 15° = 60°
So, the location is 60° east or west of the Prime Meridian, depending on whether the local time is ahead or behind UTC.
Quick Summary
| Feature | Details |
|---|---|
| Earth’s rotation | 360° in 24 hours |
| Rotation per hour | 15° |
| 1 Time Zone | 15° of longitude |
| Reference Time | UTC (Coordinated Universal Time) |
| Eastward Travel | Time becomes later (+1 hour per 15°) |
| Westward Travel | Time becomes earlier (−1 hour per 15°) |
| International Date Line | Around 180° longitude; changes the date |
| Daylight Saving Time | Clocks moved forward by 1 hour in some countries during summer |
Exam Tips
- 360° ÷ 24 = 15° per hour
- 1 hour = 15° longitude
- East = Later time (+)
- West = Earlier time (−)
- Prime Meridian = 0° longitude
- International Date Line ≈ 180° longitude
- UTC is the world’s standard time reference.
International Date Line (IDL)
The International Date Line (IDL) is an imaginary line located approximately along 180° longitude in the Pacific Ocean. It separates two consecutive calendar dates and is used to determine the change of date around the world.
Key Facts
- Located near 180° longitude, opposite the Prime Meridian (0°).
- Extends from the North Pole to the South Pole.
- Marks the boundary where the calendar date changes.
- Passes mainly through the Pacific Ocean to avoid dividing countries.
Why Does the IDL Zigzag?
- The IDL is not a straight line.
- It bends around countries and island groups so that the same country remains on the same calendar date.
- The exact route is determined by political and practical reasons, not by international law.
Crossing the International Date Line
- Traveling westward across the IDL → Add one day.
- Traveling eastward across the IDL → Subtract one day.
Easy Rule to Remember
- West → +1 Day
- East → −1 Day
Importance of the IDL
- Maintains a consistent global calendar.
- Prevents confusion in international travel and communication.
- Essential for aviation, shipping, navigation, and global business.
Interesting Facts
- The IDL was established using the 180° meridian because it passes mostly through open ocean.
- It was adopted during the International Meridian Conference (1884).
- The IDL and the 180° longitude are not exactly the same because the line bends around national borders.
- At certain times, three different calendar dates can exist simultaneously in different parts of the world due to varying time zones.
- Some countries have changed the route of the IDL to suit economic and administrative needs. For example, Kiribati (1995) and Samoa (2011) adjusted their time zones to improve trade with neighboring countries.
International Date Line vs. Prime Meridian
| Feature | International Date Line | Prime Meridian |
|---|---|---|
| Longitude | Around 180° | 0° |
| Purpose | Changes the calendar date | Starting point for measuring longitude |
| Location | Pacific Ocean | Greenwich, England |
| Crossing Effect | Date changes by one day | No date change |
Exam Tips
- Location: Approximately 180° longitude.
- Opposite of: Prime Meridian (0°).
- Westward crossing: Add 1 day.
- Eastward crossing: Subtract 1 day.
- Main purpose: Separates two consecutive calendar dates.
- Not a straight line: Curves around countries and islands.
Maps and Topographic Maps
A map is a scaled, two-dimensional representation of the Earth’s surface or a part of it. Maps help us locate places, measure distances, understand terrain, and navigate from one place to another.
A topographic map is a special type of map that shows both natural features (mountains, rivers, valleys) and man-made features (roads, railways, buildings), along with the shape and elevation of the land using contour lines.
Essential Components of a Map
┌─────────────┬──────────────┬───────────────┐
│ │ │ │
▼ ▼ ▼ ▼
Legend Scale Grid System North Arrow
(Map Key) Distance) (Coordinates) (Direction)
1. Title (Sheet Name)
- Indicates the name of the area shown on the map.
- Usually named after the largest town, city, or geographical feature.
2. Scale
The scale shows the relationship between distances on the map and actual distances on the ground.
Example:
- 1 : 50,000
- 1 cm on the map = 50,000 cm (500 m) on the ground.
Types of Scale
- Representative Fraction (RF): 1:50,000
- Graphic (Bar) Scale
- Statement Scale: 1 cm = 500 m
Large Scale vs Small Scale
| Large Scale | Small Scale |
|---|---|
| More detail | Less detail |
| Smaller area | Larger area |
| Example: 1:25,000 | Example: 1:1,000,000 |
3. Map Legend (Key)
The legend explains the symbols and colors used on the map.
It helps identify:
- Roads
- Rivers
- Railways
- Schools
- Hospitals
- Forests
- Airports
- Bridges
- Buildings
Always check the legend because symbols may differ from one map to another.
4. Grid System
Maps contain a grid of vertical and horizontal lines used to locate places accurately.
The grid system helps in:
- Navigation
- Military operations
- Emergency response
- GPS location
5. Grid Coordinates
Grid coordinates identify the exact position of a location.
Four-Digit Grid Reference
- Identifies a grid square.
- Read Eastings first, then Northings.
Example:
2345
Six-Digit Grid Reference
- Identifies an exact point inside a grid square.
Example:
234456
Golden Rule:
Read Right, Then Up
- Eastings (Right)
- Northings (Up)
6. Contour Lines
Contour lines join places of equal elevation above sea level.
Characteristics
- Never cross each other.
- Close contour lines = Steep slope.
- Wide contour lines = Gentle slope.
- Closed circles usually represent hills.
7. Contour Interval
The contour interval is the vertical distance between two adjacent contour lines.
Example:
If the contour interval is 20 meters, each contour line differs in height by 20 meters.
8. Declination Diagram
A declination diagram shows three types of north:
- True North (TN) – Geographic North Pole.
- Magnetic North (MN) – Direction indicated by a compass.
- Grid North (GN) – Direction of the map grid.
The angle between Grid North and Magnetic North is called the Grid-Magnetic (G-M) Angle.
Colors Used on Topographic Maps
| Color | Represents |
|---|---|
| Black | Man-made features (roads, railways, buildings, names) |
| Blue | Water bodies (rivers, lakes, canals, oceans) |
| Brown | Contour lines and land elevation |
| Green | Forests, vegetation, orchards |
| Red | Major roads, highways, important built-up areas |
| White | Open land with little or no vegetation |
Topographic Symbols
Topographic symbols represent natural and human-made features.
Natural Features
- Mountains
- Rivers
- Lakes
- Forests
- Hills
- Valleys
Man-made Features
- Roads
- Railways
- Schools
- Hospitals
- Airports
- Bridges
- Mosques
- Churches
Major Terrain Features
1. Hill
- An area of high ground.
- Highest point is at the center.
- Shown by closed concentric contour lines.
2. Ridge
- A long narrow area of high ground.
- Contour lines point away from higher ground.
3. Valley
- Low land between hills or mountains.
- Usually contains a river or stream.
- Contour lines form U or V shapes pointing upstream.
4. Saddle
- A low area between two hills.
- Contour lines resemble an hourglass.
5. Depression
- A low area surrounded by higher land.
- Shown by closed contour lines with inward tick marks.
Minor Terrain Features
Draw
- A small valley.
- V-shaped contour lines pointing toward higher ground.
Spur
- A short ridge extending from higher ground.
- U-shaped contour lines pointing downhill.
Cliff
- A very steep or vertical slope.
- Contour lines are extremely close together or touching.
Supplementary Terrain Features
Cut
- A man-made excavation through high ground for roads or railways.
Fill
- A man-made embankment built to raise low ground.
Grid Zone Designator
- The Earth is divided into 60 longitudinal grid zones.
- Each zone has a unique Grid Zone Designator (GZD).
- Used in military mapping, GPS, and surveying.
Protractor
A map protractor is used to:
- Measure angles (azimuths).
- Plot grid coordinates.
- Determine directions.
- Read precise map locations.
Military protractors usually measure:
- Degrees (0°–360°)
- Mils (0–6400)
Importance of Maps
Maps are used for:
- Navigation
- Surveying
- Military operations
- Urban planning
- Disaster management
- Tourism
- Transportation
- Environmental studies
- Agriculture
- GPS and satellite navigation
Exam Tips (CSS/PMS/FPSC)
- Map: A scaled representation of the Earth’s surface.
- Topographic Map: Shows relief using contour lines.
- Scale: Ratio between map distance and ground distance.
- Legend: Explains symbols and colors.
- Contour Lines: Join places of equal elevation.
- Close Contours: Steep slope.
- Wide Contours: Gentle slope.
- Four-digit Grid: Identifies a grid square.
- Six-digit Grid: Identifies an exact location.
- Read Grid References: Right first (Eastings), then Up (Northings).
- Brown = Elevation
- Blue = Water
- Green = Vegetation
- Black = Man-made features
Map Scale and Map Projections
What is Map Scale?
A map scale is the ratio between a distance on the map and the corresponding distance on the Earth’s surface. It shows how much the real world has been reduced to fit on a map.
Example:
- 1 : 50,000
- 1 cm on the map = 50,000 cm (500 m) on the ground
Types of Map Scale
1. Representative Fraction (RF)
Expressed as a ratio or fraction.
Examples:
- 1 : 25,000
- 1 : 50,000
- 1 : 100,000
2. Statement Scale
Expressed in words.
Examples:
- 1 cm = 1 km
- 1 inch = 1 mile
3. Graphic (Bar) Scale
A line divided into equal sections showing actual ground distances.
0     1     2     3 km
|-----|-----|-----|
Large Scale vs Small Scale
| Large Scale Map | Small Scale Map |
|---|---|
| Covers a small area | Covers a large area |
| Shows more detail | Shows less detail |
| Used for cities and towns | Used for countries and continents |
| Example: 1:25,000 | Example: 1:1,000,000 |
Easy Trick
- Small denominator = Large Scale = More Detail
- Large denominator = Small Scale = Less Detail
Importance of Map Scale
Map scale helps us to:
- Measure actual distances.
- Calculate area.
- Estimate travel time.
- Understand the level of detail.
- Compare different maps accurately.
Types of Maps Based on Purpose
Maps are prepared for different purposes.
Topographic Maps
- Show natural and man-made features.
- Display land relief using contour lines.
Political Maps
- Show countries, states, capitals, and boundaries.
Physical Maps
- Show mountains, rivers, plains, deserts, and oceans.
Road Maps
- Show highways, roads, railways, and transport routes.
Geological Maps
- Show different rock types and geological structures.
Soil Maps
- Show soil types and fertility.
Weather Maps
- Show temperature, rainfall, pressure, and wind.
Population Maps
- Show population density and distribution.
Nautical Charts
- Used for sea navigation.
- Show coastlines, harbors, water depths, and hazards.
Aeronautical Charts
- Used by pilots for air navigation.
Nautical Charts
A nautical chart is a special map used for navigation at sea.
It shows:
- Coastlines
- Harbors
- Water depth (Soundings)
- Lighthouses
- Reefs
- Rocks
- Navigation routes
Types of Nautical Charts
| Chart Type | Scale | Use |
|---|---|---|
| Ocean Chart | 1:5,000,000 or smaller | Long-distance voyages |
| Sailing Chart | 1:600,000 – 1:5,000,000 | Offshore navigation |
| General Chart | 1:100,000 – 1:600,000 | Coastal navigation |
| Coast Chart | 1:50,000 – 1:100,000 | Entering and leaving ports |
| Harbour Chart | Larger than 1:50,000 | Navigation inside harbors |
Map Projection
A map projection is a method of representing the Earth’s curved surface on a flat map.
Since the Earth is spherical, no flat map can represent the Earth’s shape, size, distance, and direction perfectly. Every projection introduces some distortion.
Why Are Map Projections Needed?
Map projections help to:
- Draw maps on flat paper or screens.
- Represent the entire Earth.
- Support navigation.
- Measure distance and direction.
- Produce thematic and world maps.
Types of Map Projections
1. Cylindrical Projection
- Earth is projected onto a cylinder.
- Meridians are straight vertical lines.
- Parallels are straight horizontal lines.
- Best for areas near the Equator.
Mercator Projection
- Most famous cylindrical projection.
- Preserves direction and angles.
- Widely used for marine navigation.
- Greatly enlarges areas near the poles.
Examples:
- World maps
- Navigation charts
- Google Maps (modified Mercator)
2. Conic Projection
- Earth is projected onto a cone.
- Parallels appear as arcs.
- Meridians converge toward the pole.
- Best for mid-latitude regions.
Uses
- National maps
- Weather maps
- Large countries like the USA and Canada
3. Azimuthal (Planar) Projection
- Earth is projected onto a flat plane.
- Directions from the center are accurate.
- Best for polar regions.
Uses
- Polar maps
- Air route maps
- Radio communication maps
Common Map Projections
| Projection | Best For | Main Advantage | Limitation |
|---|---|---|---|
| Mercator | Navigation | Accurate direction | Distorts area near poles |
| Transverse Mercator | North–South regions | High accuracy | Limited area coverage |
| Conic | Mid-latitudes | Accurate shape | Not suitable for world maps |
| Azimuthal | Polar regions | Accurate direction from center | Distortion increases outward |
| Gnomonic | Great-circle routes | Shortest path shown as straight line | High distortion away from center |
| Orthographic | Globe-like view | Realistic appearance | Cannot show the entire Earth |
Distortion in Map Projections
Because the Earth is round, every flat map distorts one or more of the following:
- Area
- Shape
- Distance
- Direction
Different projections are designed to minimize different types of distortion.
Choosing the Right Projection
| Purpose | Recommended Projection |
|---|---|
| Sea Navigation | Mercator |
| Air Routes | Gnomonic or Azimuthal |
| Polar Regions | Polar Azimuthal |
| Mid-Latitude Countries | Conic |
| World Maps | Robinson or Winkel Tripel (modern atlases) |
Important Facts
- A globe is the most accurate representation of the Earth.
- Flat maps always involve some distortion.
- Topographic maps are the base for many thematic maps.
- Modern maps are created using GIS (Geographic Information Systems), Remote Sensing, GPS, satellite imagery, and digital cartography.
Exam Tips (CSS, PMS, FPSC)
- Map Scale: Ratio of map distance to ground distance.
- Large Scale: More detail, smaller area.
- Small Scale: Less detail, larger area.
- RF Scale Example: 1:50,000.
- Mercator Projection: Best for navigation.
- Conic Projection: Best for mid-latitudes.
- Azimuthal Projection: Best for polar regions.
- Topographic Map: Shows elevation with contour lines.
- Nautical Chart: Used for sea navigation.
- No flat map is free from distortion.
Geographic Information System (GIS)
What is GIS?
A Geographic Information System (GIS) is a computer-based system used to collect, store, manage, analyze, and display geographical (spatial) data.
It helps users understand patterns, relationships, and trends by combining maps with different types of data.
Definition
GIS (Geographic Information System) is a computer system that captures, stores, analyzes, manages, and presents geographically referenced information.
Components of GIS
GIS consists of four major components:
| Component | Function |
|---|---|
| Input System | Converts maps and spatial data into digital form (Digitizing). |
| Storage & Retrieval | Stores and manages geographical data. |
| Analysis System | Processes and analyzes spatial information. |
| Output System | Produces maps, charts, reports, and answers to geographic queries. |
Uses of GIS
GIS is widely used in:
- Urban Planning
- Environmental Management
- Agriculture
- Disaster Management
- Transportation Planning
- Water Resource Management
- Forestry
- Military Operations
- Marketing & Business Site Selection
- Population Studies
- Weather Forecasting
Advantages of GIS
- Accurate map creation
- Better decision-making
- Efficient data storage
- Easy comparison of different map layers
- Time and cost saving
- Supports scientific research
History of GIS
1950s
- Development of computerized cartography.
- Waldo Tobler developed the MIMO (Map In–Map Out) system.
1963
- Roger Tomlinson developed the first true GIS for Canada.
- Known as the Father of GIS.
Important Contributors
| Scientist | Contribution |
|---|---|
| Waldo Tobler | MIMO System |
| Roger Tomlinson | First GIS (Father of GIS) |
| Ian McHarg | Digital map overlay concept |
| Jacqueline Tyrwhitt | Introduced thematic map overlays |
Types of GIS Data
GIS stores information in two formats.
1. Vector Data
Represents geographical features using coordinates.
Used for
- Points (Schools, Hospitals)
- Lines (Roads, Rivers)
- Polygons (Countries, Lakes)
Advantages
- High accuracy
- Small storage size
- Best for boundaries
2. Raster Data
Represents the Earth’s surface using grid cells (pixels).
Used for:
- Satellite Images
- Elevation
- Temperature
- Rainfall
- Land Cover
Advantages
- Better for continuous data
- Easy image processing
TIN (Triangulated Irregular Network)
- Vector-based surface model
- Represents terrain using connected triangles
- Used for slope and elevation analysis
DEM (Digital Elevation Model)
A raster-based model showing ground elevation.
Used for:
- Watershed analysis
- Flood prediction
- Terrain modeling
- Contour generation
GIS Operations
GIS can perform:
- Overlay Analysis
- Buffer Analysis
- Route Optimization
- Site Selection
- Network Analysis
- Spatial Query
- Viewshed Analysis
- Terrain Analysis
- Cartographic Modeling
Cartography
Definition
Cartography is the science and art of making maps.
It involves collecting, analyzing, and representing geographical information on maps.
Importance of Cartography
- Navigation
- Urban Planning
- Military Operations
- Disaster Management
- Education
- Tourism
- Resource Management
Types of Maps
General Purpose Maps
Show many geographical features together.
Examples:
- Political Maps
- Physical Maps
- Road Maps
Thematic Maps
Show only one specific topic.
Examples:
- Population Density
- Rainfall
- Climate
- Soil
- Vegetation
- Land Use
History of Cartography
Ancient Period
- Babylonians created early maps.
- Ptolemy (2nd Century AD) developed scientific mapmaking.
Middle Ages
- T-Maps centered on Jerusalem.
- Portolan Charts improved marine navigation.
Modern Era
Modern cartography uses:
- GIS
- GPS
- Remote Sensing
- Aerial Photography
- Satellite Imagery
- Google Earth
Famous Cartographers
| Name | Contribution |
|---|---|
| Ptolemy | Father of Scientific Cartography |
| Gerardus Mercator | Mercator Projection |
| Marie Tharp | Ocean Floor Mapping |
| Muhammad al-Idrisi | Medieval World Maps |
Map Projections
Common projections include:
- Mercator Projection
- Cylindrical Projection
- Lambert Conformal Projection
- Conic Projection
- Azimuthal Projection
Navigation
Definition
Navigation is the science of determining the position, direction, and route to reach a destination safely.
Objectives of Navigation
- Stay on course
- Avoid collisions
- Save fuel
- Reach destination on time
Types of Navigation
- Marine Navigation
- Air Navigation
- Land Navigation
- Space Navigation
Basic Navigation Methods
1. Pilotage
Uses visible landmarks.
2. Dead Reckoning
Determines position using:
- Direction
- Speed
- Time
- Previous known position
Errors accumulate over time.
3. Celestial Navigation
Uses:
- Sun
- Moon
- Stars
- Sextant
4. Radio Navigation
Uses radio signals for determining position.
Examples:
- VOR
- DME
- ILS
5. Satellite Navigation
Uses satellites.
Examples:
- GPS (USA)
- GLONASS (Russia)
- Galileo (European Union)
- BeiDou (China)
Important Navigation Instruments
| Instrument | Purpose |
|---|---|
| Compass | Shows direction |
| Sextant | Measures celestial angles |
| Marine Chronometer | Accurate timekeeping |
| Astrolabe | Early astronomical navigation |
| Cross Staff | Latitude measurement |
| Radar | Detects obstacles |
| GPS Receiver | Satellite positioning |
| Pitot Tube | Measures speed |
| Echo Sounder | Measures water depth |
Magnetic Compass
Working Principle
The magnetic needle aligns with Earth’s magnetic field and points toward magnetic north.
Parts
- Compass Card
- Magnetic Needle
- Pivot
- Compass Bowl
- Lubber Line
- Binnacle
Marine Chronometer
- Invented by John Harrison
- Solved the longitude problem.
- Measures accurate time at sea.
GPS (Global Positioning System)
Features
- Satellite-based navigation
- Accurate location anywhere on Earth
- Works 24 hours a day
- Used in vehicles, aircraft, ships, smartphones, and military operations
Modern Navigation Technologies
- GPS
- GIS
- Radar
- Sonar
- Satellite Navigation
- Inertial Navigation System (INS)
- Electronic Charts (ECDIS)
- Remote Sensing
Important Personalities
| Personality | Contribution |
|---|---|
| Roger Tomlinson | Father of GIS |
| Waldo Tobler | MIMO System |
| Ian McHarg | Map Overlay Concept |
| Ptolemy | Scientific Cartography |
| Gerardus Mercator | Mercator Projection |
| John Harrison | Marine Chronometer |
| Marie Tharp | Ocean Floor Mapping |
| Matthew Flinders | Compass Improvements |
CSS/PMS Important One-Liners
- GIS = Geographic Information System.
- Roger Tomlinson is called the Father of GIS.
- Vector data uses points, lines, and polygons.
- Raster data uses pixels (grid cells).
- TIN represents terrain using triangles.
- DEM represents elevation using raster grids.
- Cartography is the science and art of map-making.
- Ptolemy is known as the Father of Scientific Cartography.
- Mercator Projection is widely used for marine navigation.
- GPS is a satellite-based navigation system.
- Dead Reckoning estimates position using speed, direction, and time.
- John Harrison invented the Marine Chronometer, solving the longitude problem.
- Sextant measures the angle between celestial bodies and the horizon.
- Compass points toward magnetic north, not true north.
Geographic Coordinate System (GCS)
Definition
A Geographic Coordinate System (GCS) is a global reference system used to identify the exact location of any place on Earth using latitude and longitude. It is based on the Earth’s spherical (or ellipsoidal) shape and is widely used in GPS, GIS, mapping, aviation, navigation, and satellite systems.
Components of Geographic Coordinates
1. Latitude
- Latitude is the angular distance of a place north or south of the Equator.
- Measured in degrees (°).
- Range:
- 0° at the Equator
- 90° North (N) at the North Pole
- 90° South (S) at the South Pole
- Lines of latitude are called Parallels.
- Parallels:
- Run east-west
- Never intersect
- Form complete circles around Earth
- Become smaller toward the poles
Examples
- Islamabad: 33.6844° N
- Cape Town: 33.9249° S
2. Longitude
- Longitude is the angular distance of a place east or west of the Prime Meridian (Greenwich Meridian).
- Measured in degrees (°).
- Range:
- 0° at the Prime Meridian
- 180° East (E)
- 180° West (W)
Lines of longitude are called Meridians.
Characteristics
- Run north-south
- Meet at both poles
- Divide Earth into Eastern and Western Hemispheres
- Distance between meridians decreases toward the poles
Examples
- New York: 74.0060° W
- Tokyo: 139.6503° E
3. Altitude (Optional)
- Altitude is the height of a location above mean sea level.
- Important in:
- Aviation
- Surveying
- Mountain mapping
- GPS navigation
Commercial aircraft generally fly at 30,000–40,000 feet.
Important Reference Lines
Equator
- Latitude 0°
- Divides Earth into:
- Northern Hemisphere
- Southern Hemisphere
Prime Meridian (Greenwich Meridian)
- Longitude 0°
- Passes through Greenwich, England
- Divides Earth into:
- Eastern Hemisphere
- Western Hemisphere
Graticule
A Graticule is the network of latitude and longitude lines covering the Earth’s surface.
- Origin (0°, 0°) is the intersection of:
- Equator
- Prime Meridian
It forms the reference grid used in maps and GPS.
Difference Between Latitude and Longitude
| Latitude | Longitude |
|---|---|
| Measures north-south position | Measures east-west position |
| Parallel lines | Meridian lines |
| Never meet | Meet at the poles |
| Range: 0°–90° N/S | Range: 0°–180° E/W |
| Determines distance from Equator | Determines distance from Prime Meridian |
Geographic Coordinate Example
| City | Latitude | Longitude |
|---|---|---|
| Islamabad | 33.6844° N | 73.0479° E |
| London | 51.5074° N | 0.1278° W |
| Paris | 48.8566° N | 2.3522° E |
| Tokyo | 35.6762° N | 139.6503° E |
| Sydney | 33.8688° S | 151.2093° E |
Geographic Coordinate System in GIS
GIS uses the Geographic Coordinate System to:
- Store geographic locations
- Display maps accurately
- Perform spatial analysis
- Overlay multiple map layers
- Support GPS and satellite imagery
How Coordinates Are Determined
Traditional Methods
Earlier navigators used:
- Sextant
- Chronometer
- Sun and stars
to calculate latitude and longitude.
Modern Methods
Today, coordinates are determined using:
- GPS (Global Positioning System)
- GNSS (Global Navigation Satellite System)
- Satellite navigation
- Digital mapping software
Applications of Geographic Coordinates
Navigation
- GPS navigation
- Marine navigation
- Air navigation
GIS
- Spatial analysis
- Resource management
- Urban planning
- Disaster management
Aviation
- Flight route planning
- Aircraft navigation
- Air traffic control
- Instrument Landing System (ILS)
Mapping
- Google Maps
- Google Earth
- OpenStreetMap
- Surveying
Sphere vs. Spheroid (Ellipsoid)
Sphere
- Perfectly round model of Earth.
- Simpler but less accurate.
Spheroid (Ellipsoid)
- Slightly flattened at the poles.
- More accurate representation of Earth’s actual shape.
- Used in modern mapping and GPS.
Datum
A Datum is a mathematical reference framework that defines the position and size of the Earth’s spheroid and serves as the basis for measuring geographic coordinates.
Types
- Global Datum: Works worldwide (e.g., WGS84, used by GPS).
- Local Datum: Designed for a specific region (e.g., NAD27).
Important: Changing the datum changes the coordinate values of the same location.
Important Facts for CSS/PMS Exams
- Geographic Coordinate System (GCS) uses latitude and longitude.
- Latitude measures distance from the Equator.
- Longitude measures distance from the Prime Meridian (Greenwich).
- Latitude ranges from 0° to 90° N/S.
- Longitude ranges from 0° to 180° E/W.
- The Equator is 0° latitude.
- The Prime Meridian is 0° longitude.
- The intersection of the Equator and Prime Meridian is (0°, 0°).
- Latitude lines are called Parallels.
- Longitude lines are called Meridians.
- GIS, GPS, aviation, and digital mapping all rely on geographic coordinates.
- WGS84 is the most widely used global datum for GPS.
- Earth is better represented as an ellipsoid (spheroid) than a perfect sphere.